
This Excel file is designed to represent numbers using a seven-segment digital display, also known as LED display. In practice, the numbers from 0 to 9 are displayed by turning on and off the various luminous segments, which are arranged in a specific configuration. Each digit is represented by the activation of seven segments, each of which is controlled by a binary value (1 = on, 0 = off).
Display concept at 7 Segments
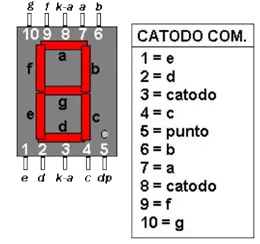
Each digit on a 7 segment display can be represented with a seven-bit sequence (0 or 1), where each bit corresponds to a segment of the display. For example:
| a | b | C | d | and | ♪ | g |
|---|
Table of Numbers with Accided Segments
Each letter represents one of the segments of the display, and their ignition or shutdown is determined by the combination of bits. Binary values (1 = on, 0 = off) can be used to represent each number from 0 to 9, as shown in the following table.
| 0 | 1111110 |
| 1 | 0110000 |
| 2 | 1101101 |
| 3 | 1111001 |
| 4 | 0110011 |
| 5 | 1011011 |
| 6 | 1011111 |
| 7 | 1110000 |
| 8 | 1111111 |
| 9 | 1111011 |
Project Structure in Excel
The project is structured on two main worksheets:
- Sheet 1: User interface
- Reset: A key to reset the display, setting the value to “00”.
- Input Zone of Value: You can enter a two-digit number.
- Digital display: The display displays the number entered.
- Sheet 2: Interface Machine
- This sheet contains the logical operations necessary for the conversion of the number into a display format through a 7 segment display.
- Each digit is separated and associated with the respective segments by using binary codes.
- A separate cell system represents each segment, and is colored black according to the value of the bit (1 = on).
Job description
The project was carried out in about 3 hours of work. The development process was as follows:
- Creating Input and Reset Zones: I first created the input zones where the user can enter the number and reset key, associated with a macro setting the display on “00”.
- Logical connections in the Machine Interface: In the second sheet, I created logical links to separate the inserted digit and associate it with the binary codes of the corresponding segments. Each digit is then graphically represented through a sum of bits (segments) needed to display the number.
- Management of Segments: I used the function STRINGA. EXTRACTS to separate 7-bit codes into 7 individual cells, each representing a segment of the display.
- Graphic Display Creation: In the user interface, I connected each number to the respective segments. A special choice I made was to draw small triangles to the short sides of the segments, using small cells (about 11×11 cells per triangle). This made the project more complex, but also improved the graphic appearance of the display.
- Coloring of the Segments: I applied a conditional formatting rule to color the cells that contain the value “1”, simulating the ignition of segments.
- Error Management: If the user enters a number greater than 99, a message is displayed in the “ERRORE” cell, indicating that the value is out of the allowed range.
Link to Display download type on Excel Click here.


